Covid-19 Classifier: Classification on Lung CT Scans
In this post, we will build an Covid-19 image classifier on lung CT scan data. This is a Kaggle dataset, you can download the data using this link or use Kaggle API. This is the Part I of the Covid-19 Series.
This dataset contains 20 cases of Covid-19. It has 4 folders and 1 metadata:
ct_scans/: ct scans datainfection_mask/: infection masks for the ct scans datalung_mask/: lung masks for the ct scanslung_and_infection_mask/: lung and infection masks for ct scans- the metadata contains data file paths in the above four directories.
First, we import necessary libraries and modify the paths in the metadata (because I am using Google Colab rather than Kaggle).
# imoprt libraries
import pandas as pd
import numpy as np
import glob
import matplotlib.pyplot as plt
import tensorflow as tf

import sys
import random
import warnings
warnings.filterwarnings('ignore')

import cv2
import os
from PIL import Image
import PIL
from sklearn.model_selection import train_test_split
from sklearn.utils import class_weight
import nibabel as nib

from pylab import rcParams

from tensorflow.keras.callbacks import Callback
from tensorflow.keras import datasets, layers, models
from tensorflow.keras.models import Model, load_model, Sequential
from tensorflow.keras.layers import Input, BatchNormalization, Activation, Dense, Dropout, Flatten
from tensorflow.keras.layers import  Conv2D,  MaxPooling2D, GlobalMaxPooling2D
from tensorflow.keras.layers import concatenate, add
from tensorflow.keras.callbacks import ModelCheckpoint
from tensorflow.keras.optimizers import Adam
from tensorflow.keras.preprocessing.image import ImageDataGenerator, array_to_img, img_to_array, load_img
from tensorflow.keras import backend as K

# Read metadata and modify image path
raw_data = pd.read_csv('./metadata.csv')
raw_data = raw_data.replace('../input/covid19-ct-scans/','./',regex=True)
raw_data.shape
def clahe_enhancer(img, demo=False):
    img = np.uint8(img*255)
    clahe = cv2.createCLAHE(clipLimit=3.0, tileGridSize=(8,8))
    clahe_img = clahe.apply(img)
    if demo:
        img_flattened = img.flatten()
        clahe_img_flattened = clahe_img.flatten()
        fig = plt.figure()
        rcParams['figure.figsize'] = 10,10

        plt.subplot(2, 2, 1)
        plt.imshow(img, cmap='bone')
        plt.title("Original CT-Scan")

        plt.subplot(2, 2, 2)
        plt.hist(img_flattened)
        plt.title("Histogram of Original CT-Scan")

        plt.subplot(2, 2, 3)
        plt.imshow(clahe_img, cmap='bone')
        plt.title("CLAHE Enhanced CT-Scan")

        plt.subplot(2, 2, 4)
        plt.hist(clahe_img_flattened)
        plt.title("Histogram of CLAHE Enhanced CT-Scan")

    return clahe_img
Here is an example of CLAHE enhancement on an original image.
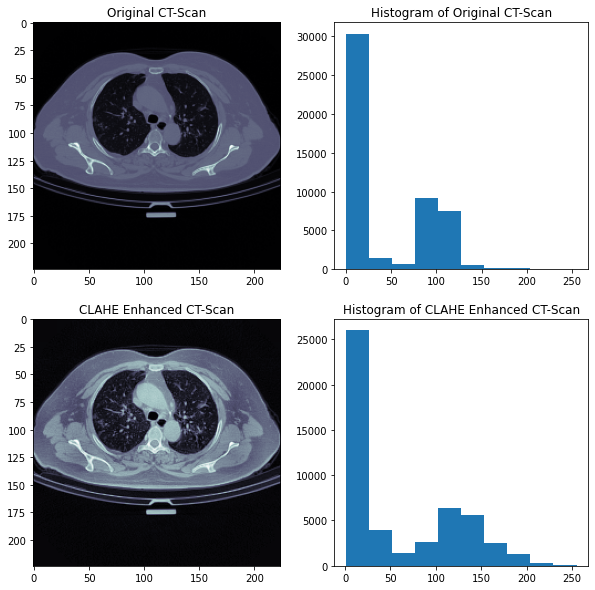
From the above figure, we can find out another issue with the original image data. There is too much redundant information in the original images, i.e. the black space, the big porting of body part. We know that for Covid-19 diagnostics, we need to extract as much information as possible from the left and right lungs. So the Region of Interest in this case is the lung regions in the image. We need only the ROIs for Covid-19 detection. So we need properly crop the original image.
Cropping
Each CT scan in our dataset has its corresponding lungs mask. We can use the lungs mask to find out the ROI for cropping. So we can image for a possible complete Covid-19 diagonsis pipeline can be:
- First, semantic segmentation to get the lungs mask.
- Second, using the lungs mask to crop the ROIs.
- Then, send the ROIs to a classifier for Covid-19 diagnosis.
We define a function to crop the lungs region in the lungs mask image.
def cropper(test_img):

    test_img = test_img*255
    test_img = np.uint8(test_img)
    # ret, thresh = cv2.threshold(test_img, 50, 255, cv2.THRESH_BINARY + cv2.THRESH_OTSU)
    # ret, thresh = cv2.threshold(test_img, ret, 255, cv2.THRESH_BINARY + cv2.THRESH_OTSU)
    contours,hierarchy = cv2.findContours(test_img, cv2.RETR_TREE, cv2.CHAIN_APPROX_SIMPLE)
    areas = [cv2.contourArea(c) for c in contours]
    x = np.argsort(areas)
    max_index = x[x.size - 1]
    cnt1=contours[max_index]
    second_max_index = x[x.size - 2]
    cnt2 = contours[second_max_index]

    x,y,w,h = cv2.boundingRect(cnt1)
    p,q,r,s = cv2.boundingRect(cnt2)
    cropped1 = test_img[y:y+h, x:x+w]
    cropped1 = cv2.resize(cropped1, dsize=(125,250), interpolation=cv2.INTER_AREA)
    cropped2 = test_img[q:q+s, p:p+r]
    cropped2 = cv2.resize(cropped2, dsize=(125,250), interpolation=cv2.INTER_AREA)

    if x < p:
        fused = np.concatenate((cropped1, cropped2), axis=1)
    else:
        fused = np.concatenate((cropped2, cropped1), axis=1)

    # super_cropped = test_img[y+7:y+h-20, x+25:x+w-25]
    points_lung1 = []
    points_lung2 = []
    points_lung1.append(x); points_lung1.append(y); points_lung1.append(w); points_lung1.append(h)
    points_lung2.append(p); points_lung2.append(q); points_lung2.append(r); points_lung2.append(s)

    return(fused, points_lung1, points_lung2)
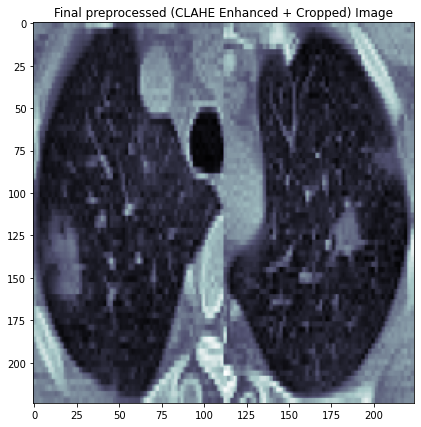
Following is an example image after CLAHE enhance, cropping and resizing.
Load and Prepare Data
Define a function to read .nii files
The dataset contains CT scans with masks of 20 cases of Covid-19. There are 20 .nii files in each folder of the dataset. Each .nii file contains around 180 slices (images). Total slices are 3520. These have been sliced out by 20% in the front and by 20% in the last of each file since in general these didn't had any infection masks and some didn't had the lungs, removed as noise. Also, images had pixel values in a very large range. We need to normalize the pixel values.
all_points1 = []
all_points2 = []

def read_nii(filepath, data, string):
    '''
    Reads .nii file and returns pixel array

    '''
    global all_points1
    global all_points2
    ct_scan = nib.load(filepath)
    array   = ct_scan.get_fdata()
    array   = np.rot90(np.array(array))
    slices = array.shape[2]
    array = array[:,:,round(slices*0.2):round(slices*0.8)]
    array = np.reshape(np.rollaxis(array, 2),(array.shape[2],array.shape[0],array.shape[1],1))

    if string == "lungs":
        all_points1 = []
        all_points2 = []

    for img_no in range(0, array.shape[0]):
        if string == 'lungs' and np.unique(array[img_no]).size == 1:
            continue
        img = cv2.resize(array[img_no], dsize=(img_size, img_size), interpolation=cv2.INTER_AREA)
        # nomalize img
        xmax, xmin = img.max(), img.min()
        img = (img - xmin)/(xmax - xmin)

        if string == 'lungs':
            # img = np.uint8(img*255)
            img[img>0]=1
            img, points1, points2 = cropper(img)
            all_points1.append((points1[0], points1[1], points1[2], points1[3]))
            all_points2.append((points2[0], points2[1], points2[2], points2[3]))
            continue

        if string == "cts" and img_no < len(all_points1):
            img = clahe_enhancer(img)
            a,b,c,d = all_points1[img_no]
            e,f,g,h = all_points2[img_no]
            img1 = img[b:b+d, a:a+c]
            img1 = cv2.resize(img1, dsize=(125,250), interpolation=cv2.INTER_AREA)
            img2 = img[f:f+h, e:e+g]
            img2 = cv2.resize(img2, dsize=(125,250), interpolation=cv2.INTER_AREA)
            if a<e:
                img = np.concatenate((img1, img2), axis=1)
            else:
                img = np.concatenate((img2, img1), axis=1)

        if string == "infections" and img_no < len(all_points1):
            a,b,c,d = all_points1[img_no]
            e,f,g,h = all_points2[img_no]
            img = np.uint8(img*255)
            img1 = img[b:b+d, a:a+c]
            img1 = cv2.resize(img1, dsize=(125,250), interpolation=cv2.INTER_AREA)
            img2 = img[f:f+h, e:e+g]
            img2 = cv2.resize(img2, dsize=(125,250), interpolation=cv2.INTER_AREA)
            if a<e:
                img = np.concatenate((img1, img2), axis=1)
            else:
                img = np.concatenate((img2, img1), axis=1)
        img = cv2.resize(img, dsize=(img_size, img_size), interpolation=cv2.INTER_LINEAR)
        data.append(img)
Load Image Data
Start loading the data, we need to read in the lungs mask data first to get the ROIs for other images. We have 2112 CT scan images in total. We dropped first 20% and last 20% scans in each .nii file.
cts = []
lungs = []
infections = []
img_size = 224
for i in range(0, raw_data.shape[0]):
    read_nii(raw_data.loc[i,'lung_mask'], lungs, 'lungs')
    read_nii(raw_data.loc[i,'ct_scan'], cts, 'cts')
    read_nii(raw_data.loc[i,'infection_mask'], infections, 'infections')

print(len(cts) , len(infections))
Load Target Label
The labels of CT images are dependant on their infection masks. If an CT image has an empty infection mask (all black), then its label is "0", denoted as "Normal". On the contrary, if the infeciont mask for an CT image is not empty, then its label is "1", denoted as "Infected". As we can see, the target label in the dataset is not balanced. We need to take this into account when training the classifier.
# load target label
y_label = []
for i in range(0, len(infections)):
  if len(np.unique(infections[i]))!=1:
    y_label.append(1)
  else:
    y_label.append(0)
print(y_label.count(0), y_label.count(1))
Prepare the Data
We prepare the data in the following steps:
- Convert data to numpy array
- Split data into training and validation data (0.7:0.3)
- Set up data augmentation generator to diversity our data and avoid overfitting.
# convert to np array
cts = np.array(cts).astype('uint8')
cts = cts.reshape(len(cts), img_size,img_size,1)
y_label = np.array(y_label)

# split data
x_train, x_valid, y_train, y_valid = train_test_split(cts, y_label, test_size = 0.3, random_state=42)

#data augmentation
aug = ImageDataGenerator(
    width_shift_range=0.1,
    height_shift_range=0.1,
    horizontal_flip=True,
    fill_mode="nearest"
    )
model = Sequential()
model.add(Conv2D(16, (3, 3), activation='relu', padding="same", input_shape=(img_size,img_size,1)))
model.add(BatchNormalization())
model.add(Conv2D(16, (3, 3), padding="same", activation='relu'))
model.add(BatchNormalization())
model.add(MaxPooling2D(pool_size=(2, 2)))

model.add(Conv2D(32, (3, 3), activation='relu', padding="same"))
model.add(BatchNormalization())
model.add(Conv2D(32, (3, 3), padding="same", activation='relu'))
model.add(BatchNormalization())
model.add(MaxPooling2D(pool_size=(2, 2)))

model.add(Conv2D(64, (3, 3), activation='relu', padding="same" ))
model.add(BatchNormalization())
model.add(Conv2D(64, (3, 3), padding="same", activation='relu'))
model.add(BatchNormalization())
model.add(MaxPooling2D(pool_size=(2, 2)))

model.add(Flatten())

model.add(Dense(64, activation='relu'))
model.add(Dropout(0.4))
model.add(Dense(1 , activation='sigmoid'))

batch_size = 32
epochs = 50
best_val_auc = -1

#model checkpoint
filepath_acc = "covid_weights_val_acc.hdf5"
checkpoint_acc = ModelCheckpoint(filepath_acc, monitor='val_acc', verbose=1, save_best_only=True, mode='max')
model.compile(loss='binary_crossentropy', optimizer=Adam(lr=0.0003), metrics=["acc"])
Training Model
The dataset is not balanced. We need to take this into account during model training. We calculate the class weights and pass the weights into the model training procedure.
# calculate class weights
weights = class_weight.compute_class_weight('balanced',
                                            np.unique(y_train),
                                            y_train)
weights=dict(enumerate(weights))

# train model
results = model.fit(aug.flow(x_train, y_train, batch_size=batch_size), epochs=epochs,
                    validation_data=(x_valid, y_valid) ,
                    steps_per_epoch = len(x_train)//batch_size,
                    callbacks = [checkpoint_acc],
                    class_weight=weights)
Epoch 48/50
46/46 [==============================] - ETA: 0s - loss: 0.2097 - acc: 0.9267
Epoch 00048: val_acc did not improve from 0.94322
46/46 [==============================] - 6s 137ms/step - loss: 0.2097 - acc: 0.9267 - val_loss: 0.1506 - val_acc: 0.9432
Epoch 49/50
46/46 [==============================] - ETA: 0s - loss: 0.1827 - acc: 0.9315
Epoch 00049: val_acc improved from 0.94322 to 0.94637, saving model to covid_weights_val_acc.hdf5
46/46 [==============================] - 6s 139ms/step - loss: 0.1827 - acc: 0.9315 - val_loss: 0.1450 - val_acc: 0.9464
Epoch 50/50
46/46 [==============================] - ETA: 0s - loss: 0.2033 - acc: 0.9232
Epoch 00050: val_acc did not improve from 0.94637
46/46 [==============================] - 6s 137ms/step - loss: 0.2033 - acc: 0.9232 - val_loss: 0.2401 - val_acc: 0.900
Model Performance
We will use the validation data to evaluate the model performance. We load the checkpoint with best validation accuracy. We can see the test loss and accuracy from the output below.
model.load_weights("covid_weights_val_acc.hdf5")
score = model.evaluate(x_valid, y_valid, batch_size=32)
print("test loss:" , score[0], "\ntest accuracy:" , score[1])
Train and Validataion Loss
rcParams['figure.figsize'] = 10,7
plt.grid('True')
plt.plot(results.history['loss'], color='m')
plt.plot(results.history['val_loss'], color='k')
plt.title('Loss')
plt.ylabel('loss')
plt.xlabel('epoch')
plt.legend(['train', 'test'], loc='upper left')
plt.show()

Train and Vilidation Accuracy
rcParams['figure.figsize'] = 10,7
plt.grid('True')
plt.plot(results.history['acc'], color='m')
plt.plot(results.history['val_acc'], color='k')
plt.title('Accuracy')
plt.ylabel('accuracy')
plt.xlabel('epoch')
plt.legend(['train', 'test'], loc='upper left')
plt.show()

Inference
Next, we'll see a couple of inference examples on our test data. We randomly select 5 images from test data and check our model's inference on these images.
from google.colab.patches import cv2_imshow

predictions = model.predict(x_valid)
predictions = np.array(predictions.flatten())

def plot_inference():
    rand = np.random.randint(0, len(x_valid), size=5)
    x_data = []
    for i in rand:
        x_test = cv2.cvtColor(x_valid[i], cv2.COLOR_GRAY2BGR)
        round_prediction = np.round(predictions[i])

        if round_prediction == 1:
            cv2.putText(x_test, "Infected: "+str(round(predictions[i],3)), (3, 20), cv2.FONT_HERSHEY_SIMPLEX, 0.5,
        	(0, 0, 255), 2)
        else:
            cv2.putText(x_test, "Normal: "+str(round(1-predictions[i],3)), (3, 20), cv2.FONT_HERSHEY_SIMPLEX, 0.5,
        	(0, 255, 0), 2)
        x_data.append(x_test)
    x_data = np.concatenate(x_data, axis=1)
    cv2_imshow(x_data)

plot_inference()

plot_inference()

Summary
In this post, we built a Covid-19 Classifer using CT scans data. We also learnt how to parse medical images in the format of .nii file. The performance of our Covid-19 Classifier works pretty well. It has a test accuracy slightly over 94%. This is the Part I of my Covid-19 series, stay tuned for PartII and maybe even Part III.
The code and trained model weights are available in this GitHub Repo.
Comments
comments powered by Disqus