Time Series Analysis (TSA) is an important part in the field of data science. TSA uses methods for analyzing time series data in order to identify useful patterns and extract meaningful statistics of the data. There are two major goals of TSA: 1) identifing patterns or features represented by the data; and 2) forecasting (using a model to predict future values based on previous data). In this article, we will do a complete machine learning pipeline on analysis time series data. We will use both ARIMA model and Prophet model to predict superstore sales data. These two models are very important in analyzing time series data.
In this article, we will do a complete machine learning pipeline from getting data through APIs, performing exploratory data analysis and formulating a real-world problem into a machine learning model. The dataset we use for this post is New Zealand Crash Analysis Dataset which is updated on a quarterly basis by the Transport Agency. The dataset was last updated on October 2018 (from January 2000). It contains all traffic crashes as reported to the Transport Agency by the NZ police. However, not all crashes are reported NZ police. A big portion of minor car crashes are settled on site by the parties without reporting to the police. The level of reporting increases with the severity of the crash. Due to the nature of non-fatal crashes it is believed that these are under-reported.
This post summarizes the top 50 most valuable Matplotlib & Seaborn data visualizations in data science.
It can be taken as a data visualization handbook for you to look up for useful visulaization. The 50 visualizations are categorized into 7 different application scenarios, and this post would mainly focuses on the first two categories, shown as follows: Correlation, Deviation, Ranking, Distribution, Composition, Change, and Groups. The whole content is divided into three parts, and this post is Part III. We will cover the last three categories.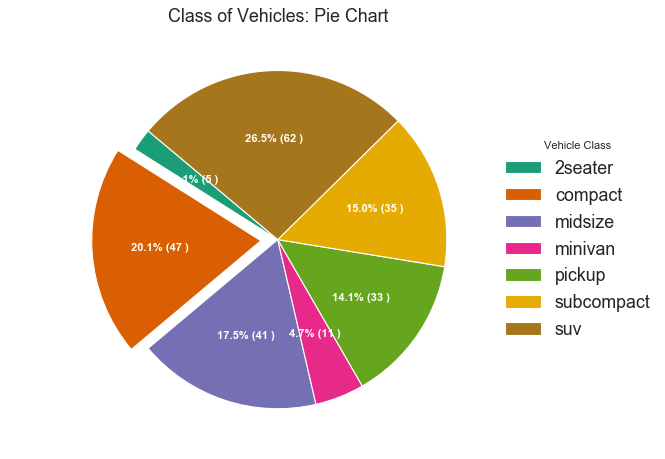
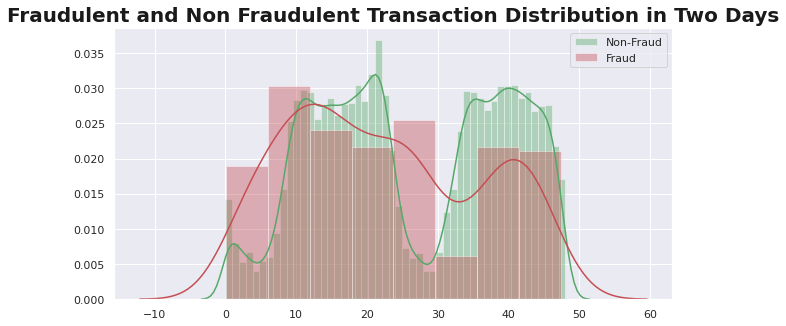
This post summarizes the top 50 most valuable Matplotlib & Seaborn data visualizations in data science. It can be taken as a data visualization handbook for you to look up for useful visulaization. The 50 visualizations are categorized into 7 different application scenarios, and this post would mainly focuses on the first two categories, shown as follows: Correlation, Deviation, Ranking, Distribution, Composition, Change, and Groups. The whole content is divided into three parts, and this post is Part II. We will cover Ranking and Distribution in this post.