Sentiment Analysis refers to the use of natural language processing, text analysis, computational linguistics, and biometrics to systematically identify, extract, quantify, and study affective states and subjective information. Sentiment analysis on tweets can be extremely useful. By analyzing the tweets, we can find the sentiment of people on certain affair, understand people's opinion. Also it can help us make right strategies/reactions. In this post, our main goal is to build a model to identify tweets with racist or sexist sentiment.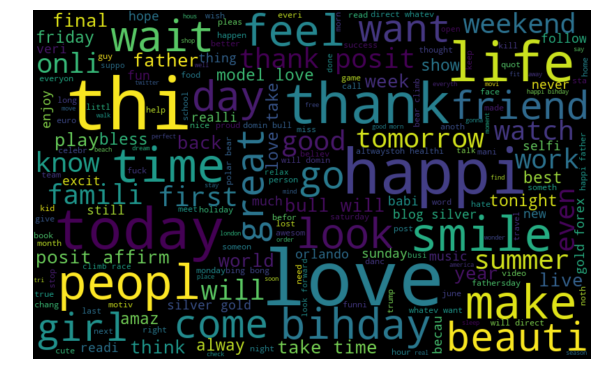
Online shopping now makes our life much easier than it used to be. Without the need of going out and visting a shopping mall or a grocery store, we can buy anything we want through e-shopping. But online shopping comes with its own caveats. One of the biggest challenges, and I guess almost every would face, is verifying the authenticity of a product. Is it as good as advertised on the e-commerce site? Will the product has a good quality? Are the reviews given by other customers really true or are they false advertising, or are they fake or bots' reviews? These are important questions customers need to ask before splurging their money.
In this article, we will do a complete machine learning pipeline from getting data through APIs, performing exploratory data analysis and formulating a real-world problem into a machine learning model. The dataset we use for this post is New Zealand Crash Analysis Dataset which is updated on a quarterly basis by the Transport Agency. The dataset was last updated on October 2018 (from January 2000). It contains all traffic crashes as reported to the Transport Agency by the NZ police. However, not all crashes are reported NZ police. A big portion of minor car crashes are settled on site by the parties without reporting to the police. The level of reporting increases with the severity of the crash. Due to the nature of non-fatal crashes it is believed that these are under-reported.
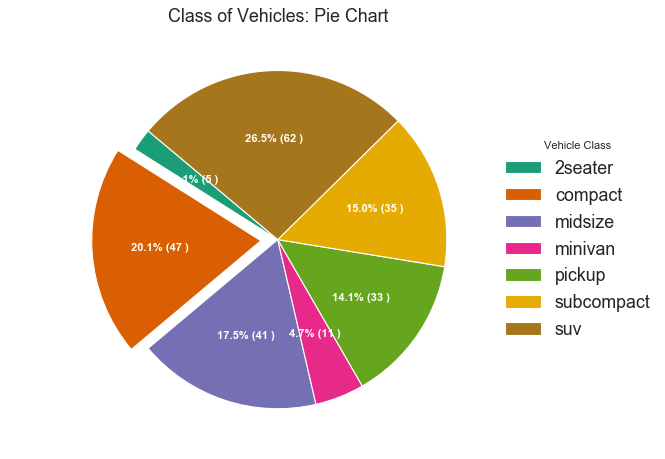
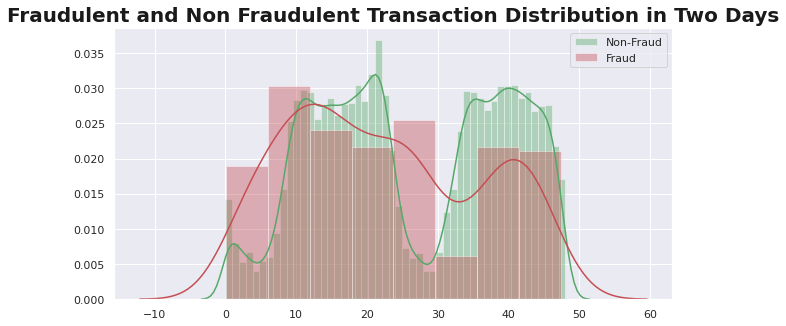
This post summarizes the top 50 most valuable Matplotlib & Seaborn data visualizations in data science.
It can be taken as a data visualization handbook for you to look up for useful visulaization. The 50 visualizations are categorized into 7 different application scenarios, and this post would mainly focuses on the first two categories, shown as follows: Correlation, Deviation, Ranking, Distribution, Composition, Change, and Groups. The whole content is divided into three parts, and this post is Part III. We will cover the last three categories.